

The opening range is the price range formed during a chosen period at the start of a trading session. In this article, we use the first 30 minutes. The highest and lowest prices recorded during that period form the range’s boundaries. These boundaries provide a reference for studying how prices behave later in the session. They do not guarantee the direction of the next move or the outcome of a trade.
The opening part of a trading session can reflect overnight news, company announcements, global developments and orders accumulated before the market opens. Prices may move quickly as participants respond to this information, although the opening period is not always the most volatile part of the day. Observing this period helps us study how prices behave as the session gets underway.
After the first 30 minutes, we can observe price in relation to the opening range high and low. Price may remain within the range, move beyond either boundary or return inside after crossing it. A move outside the range is called a breakout. Some breakouts continue, while others reverse. The charts below illustrate these different outcomes using historical examples.
Let me quickly explain by taking some charts for reference so that you get a glance at the concept. Take a look at the chart below.
It is as simple as playing Chess – the initial few moves are going to predict the direction of the game and of course, your opponent might make sudden shifts (volatility) and you need to be prepared for that as well. A flexible strategy is what I mean here.
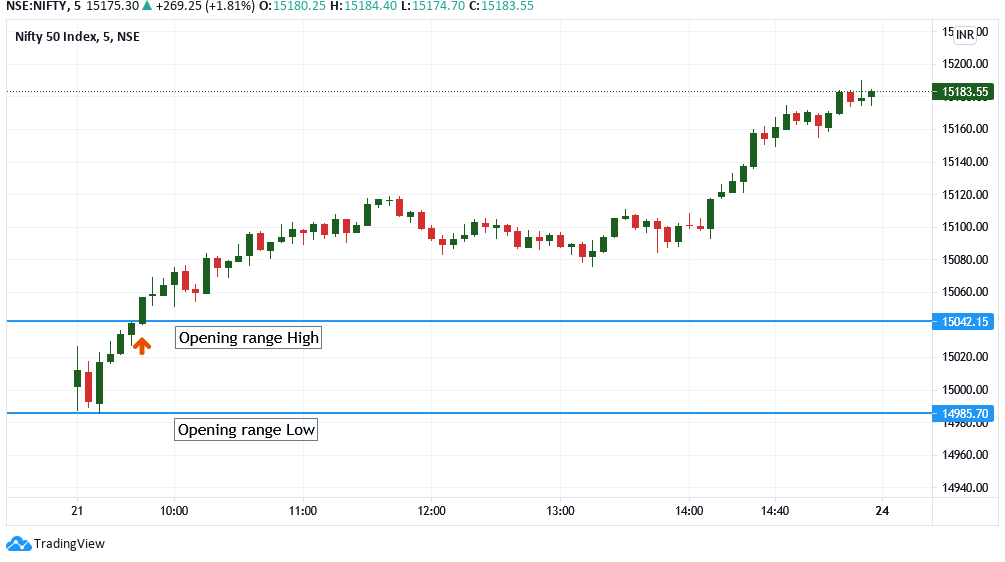
If you are looking at this chart for the first time, I know, it’s a bit too much. But to keep it simple – Can you see the markings on the chart as opening range high and low? This is a Nifty chart and as you can see – the price for the rest of the day has sustained above the opening range high and traded with positive bias for the rest of the day.
Now that’s an important indicator we shouldn’t miss.
Now to understand the difference, take a look at this below.
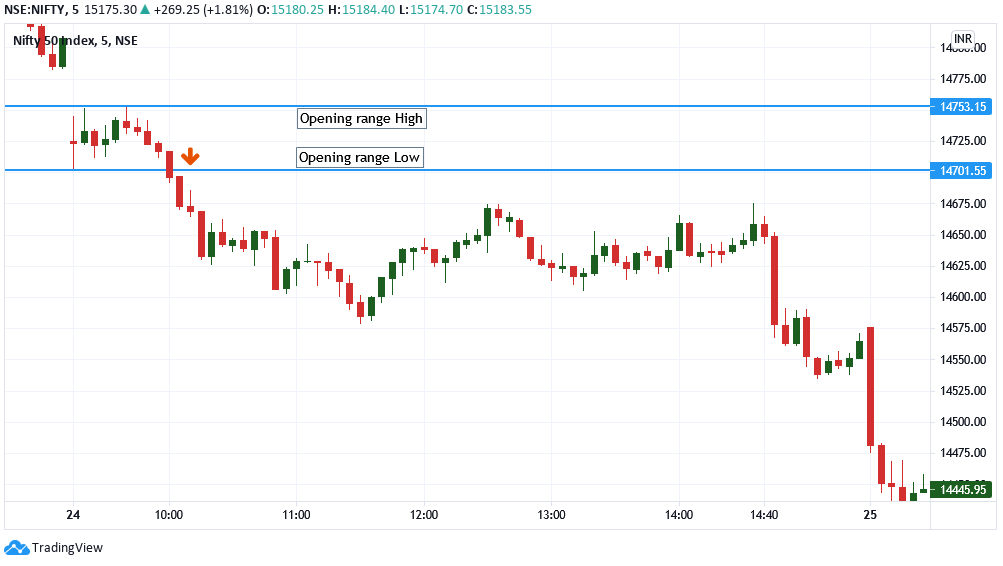
In this historical example, price moved below the opening range low and remained below it for the rest of the session. The session ended near its low, illustrating a downward breakout that continued.
The next chart shows a different outcome: price crossed the range boundaries but did not sustain those moves.
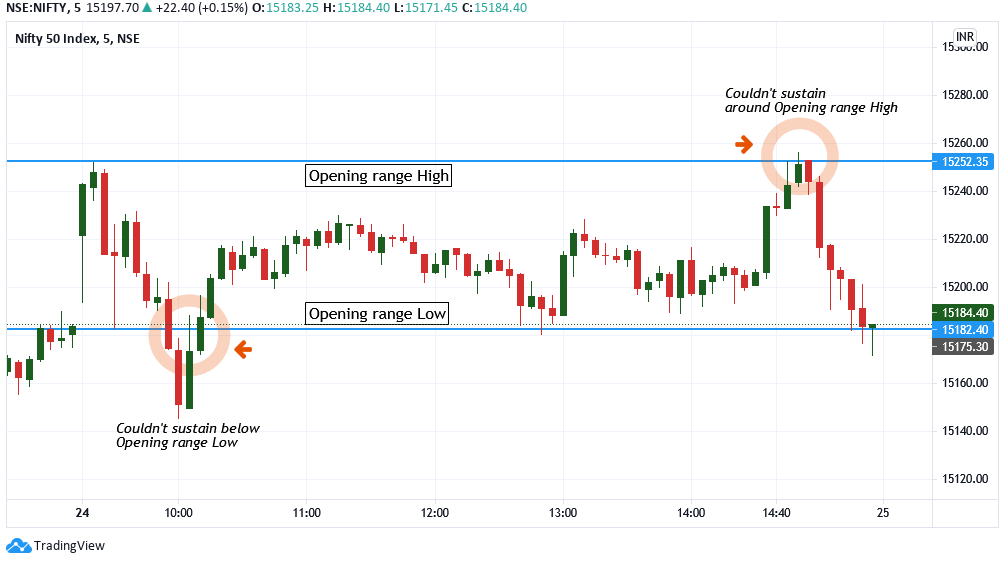
In this example, price moved below the opening range low and then returned inside the range. Later, it briefly moved above the opening range high before falling back. These moves illustrate failed breakouts.
Taken together, the three charts show that crossing an opening range boundary can lead to different outcomes. A move may continue or reverse. These selected historical examples illustrate the concept; they do not establish how often a particular outcome occurs or whether a trading approach would be profitable.
When reviewing historical charts, consider these questions:
• What period was used to define the opening range?
• Did price remain outside the range after crossing a boundary?
• Did it return inside the range or cross the opposite boundary?
• Does the interpretation still hold when you examine other sessions?
The opening range provides a framework for observing price behaviour. Understanding its limitations is part of learning the concept. Actual trading also involves costs, execution differences and the possibility of losing capital.
For structured learning in chart reading, market concepts and risk awareness, explore our one-to-one educational sessions.
Educational content only. These historical examples are not recommendations to buy, sell or hold any security.