

Haven’t we been told this – ‘what we do in the morning sets the mood for the day’. Similarly, when it comes to trading, the initial few minutes of the day are paramount to plan our intraday strategies. By observing the first 30 minutes, we could possibly get a picture of how we could draft a successful strategy for the rest of the day. And this 30 minutes is called the ‘Opening range’.
What we could observe in the first 30 minutes is that the market will be most active and volatile responding to the overnight global markets, several occurrences, and we could experience the biggest price action. It was a night for us, but not for the rest of the world, isn’t it!? The difference in time zones around the world is the primary reason.
Since it is termed a ‘range’ it should possess two endpoints i.e. a timeframe right!? The opening range has an open and close and within that range there could be a high and a low for that period for any stock.
In layman terms, if price sustains above the opening range high, it sets a positive tone for the market for that particular day. If it trades below the opening range low the tone will be negative. But also, if you strategize and plan well, there are high chances to profit from. Also, take note of the volatility.
Let me quickly explain by taking some charts for reference so that you get a glance at the concept. Take a look at the chart below.
It is as simple as playing Chess – the initial few moves are going to predict the direction of the game and of course, your opponent might make sudden shifts (volatility) and you need to be prepared for that as well. A flexible strategy is what I mean here.
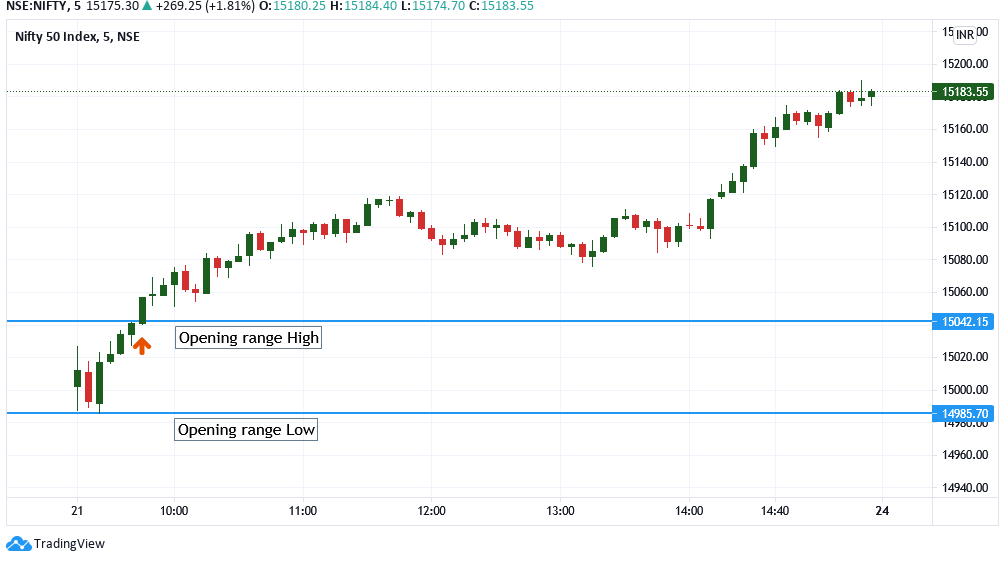
If you are looking at this chart for the first time, I know, it’s a bit too much. But to keep it simple – Can you see the markings on the chart as opening range high and low? This is a Nifty chart and as you can see – the price for the rest of the day has sustained above the opening range high and traded with positive bias for the rest of the day.
Now that’s an important indicator we shouldn’t miss.
Now to understand the difference, take a look at this below.
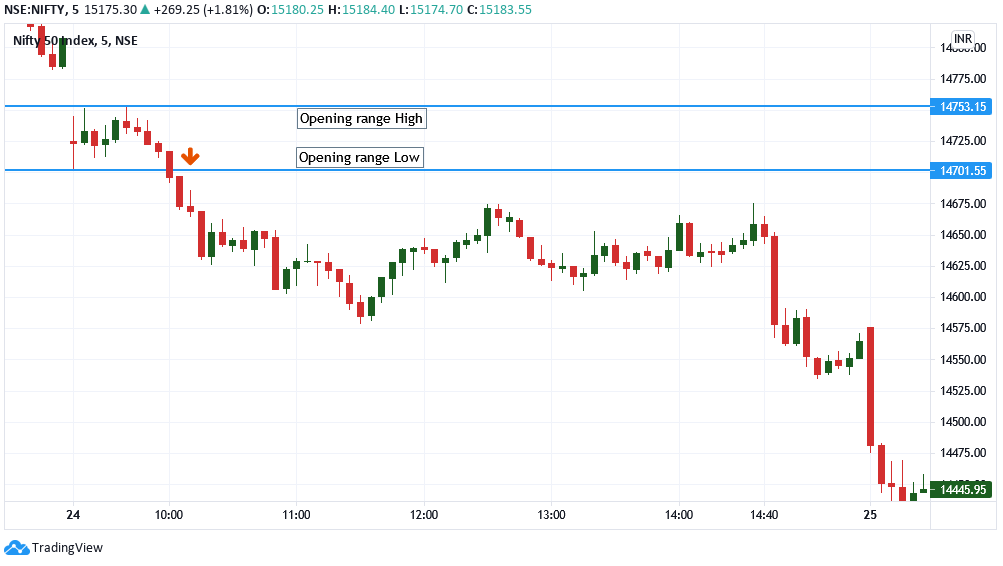
In the above Nifty chart contrary to the first chart, the price has sustained below the opening range low and continued to go down and closed at lows for the day.
Isn’t that so simple? That’s it!! This is what you need to understand about opening range breakout.
Now, let’s take a look at the chart below.
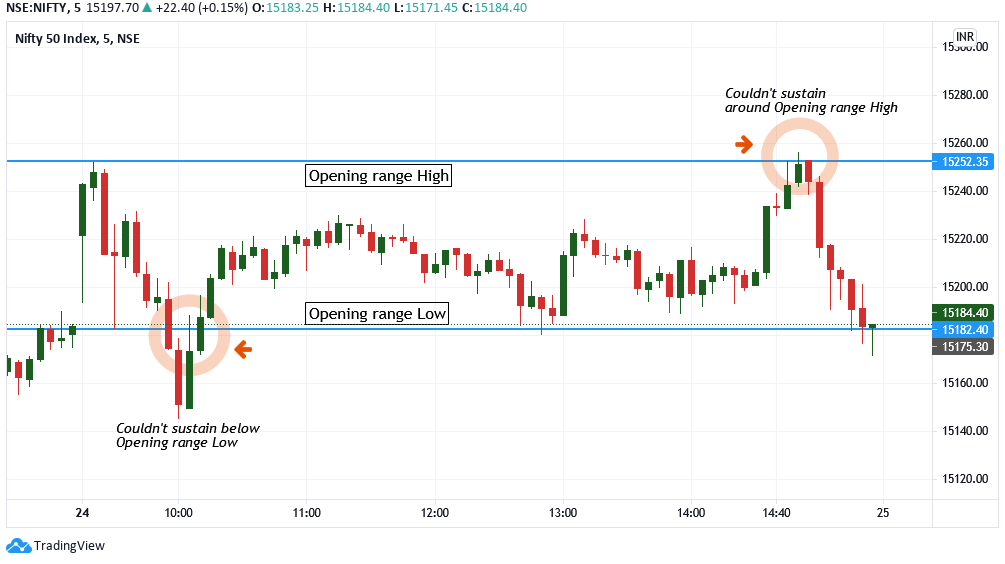
So what do you think has changed here?
The price couldn’t sustain below opening range low and retraced from opening range high after briefly crossing above opening range high.
What is the common inference is that:
- Usually, if the price breaks the opening range high, then the following price actions are likely to continue in a bullish direction (anticipate the price to rise further)
- Usually, if the price breaks the opening range low, then the following price actions are likely to continue in a bearish direction (anticipate the price to fall further)
As simple as that!
Understanding the opening range allows us to plan an intraday trading strategically. While applying an Opening range breakout strategy it’s important to consider other parameters as well.
What I have explained above is a glimpse into what an opening range breakout is in the basic of terminologies. There is more you need to learn and apply if you want to benefit from trading strategies.
If you would like to learn more through one on one personal coaching and mentoring, then click here to know more.